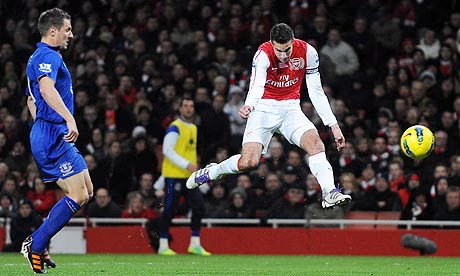

The 2011/2012 English Premier League campaign stands out as an incredibly high-scoring era, registering a total of 1,066 goals at an average of 2.81 per match. For data-driven sports bettors, this specific macro environment offers a masterclass in how defensive degradation, hyper-offensive tactical systems, and extreme historical variance converge to influence the Over/Under totals market. Merely knowing that a season is high-scoring is insufficient for long-term profitability; sustainable success requires isolating the precise variables that caused certain teams to consistently breach or fall short of standard bookmaker lines. By reviewing the quantitative goal patterns of this historic season, analysts can establish predictive benchmarks that remain highly applicable to modern totals modeling.
Why Macro Goal Averages Distort Initial Market Projections
Relying entirely on league-wide scoring averages frequently leads to structural pricing errors within the early-season totals market. In the 2011/12 season, massive scorelines involving elite squads heavily skewed the mean upward, hiding the fact that a significant portion of mid-table fixtures remained stubbornly low-scoring. When bookmakers adjusted their baseline Over/Under lines to 2.75 or 3.0 goals based on these explosive outliers, they unintentionally created immense value for Under backers who identified isolated matchups where defensive rigidity outweighed offensive output.
The Mathematical Breakdown of Home Advantage and Defensive Decay
Evaluating total goals requires an immediate separation of home and away execution profiles, as the emotional weight of a home crowd regularly alters structural team shapes. In 2011/12, several lower-tier clubs abandoned structural discipline when playing in front of their own supporters, attempting to play expansive football that left them highly vulnerable to elite counter-attacking sides. The following dataset presents a detailed breakdown of specific team performance metrics, highlighting the disparity between expectation and statistical reality across different stadium environments.
To clarify how these goals were distributed and where the market consistently miscalculated the likelihood of high-scoring games, we look at the raw productivity metrics of three distinct tactical archetypes from that season. This quantitative distribution serves to isolate which environments genuinely produced goals rather than just relying on public estimation.
- Manchester City (The Elite Standard): Scored 55 goals at home while conceding only 12, resulting in an exceptionally high home Over 2.5 conversion rate driven almost entirely by one-sided offensive dominance.
- Arsenal (The Transitional Giant): Registered 39 home goals and 35 away goals while conceding 49 total, creating a highly volatile system where both Over 2.5 and Over 3.5 lines yielded immense value due to systemic central defensive weaknesses.
- Blackburn Rovers (The Defensive Collapse): Allowed a staggering 78 goals across 38 matches, making them a consistent anchor for Over bets regardless of whether they were playing at Ewood Park or on the road.
Reviewing these specific profiles reveals that high-scoring teams generally fall into two categories: those that control matches through offensive supremacy, and those whose structural defensive failure guarantees goals at both ends. Arsenal and Blackburn represented premium targets for totals bettors because their tactical setups actively invited chaos, ensuring that market projections based on historical defensive reputations were routinely shattered by real-world defensive frailty.
How Tactical Bifurcation Influenced the Standard 2.5 Goal Line
During the 2011/12 campaign, the Premier League experienced a distinct tactical bifurcation, where traditional direct British setups clashed directly with possession-heavy, continental European models. This stylistic clash directly impacted how goals were generated across the calendar year, as teams utilizing high defensive lines were systematically picked apart by opponents featuring rapid inside forwards. Understanding how these contrasting ideologies affected actual match tempos allows an analyst to look past simple team names and focus entirely on the spatial conflicts that drive high-velocity goal creation.
Historical Anomalies and Their Long-Term Impact on Totals Modeling
Extreme scorelines, such as Manchester United’s 8-2 victory over Arsenal or Manchester City’s 6-1 triumph at Old Trafford, create a massive psychological ripple effect across the sports betting ecosystem. These anomalies cause recreational bettors to suffer from availability bias, assuming that subsequent matchups featuring those teams will automatically result in a deluge of goals. Experienced modelers exploit this bias by aggressively backing the Under in the immediate aftermath of historical blowouts, capitalising on heavily inflated lines before the market undergoes a natural mathematical correction.
The Seasonal Progression of Defensive Cohesion and Over/Under Volatility
A critical factor that totals bettors must track is the chronological trajectory of defensive organization from August through May. Teams routinely begin the season with unrefined defensive shapes and poor communication metrics, leading to an early spike in successful Over wagers across the first two months of the campaign. Observing these early defensive vulnerabilities provides an immediate window for action, forcing smart analysts to seek out premium digital spaces capable of offering immediate market access before odds compilers tighten their numbers. If a bettor notices an unexpected surge in early-season transition speed, executing timely wagers on a highly responsive betting platform ensures that the captured line movement translates directly into long-term closing line value.
Autumn Unpredictability and Transitional Openness
During the initial ten gameweeks of the 2011/12 season, coaching staffs were still integrating summer signings into their core defensive units. This lack of structural cohesion resulted in a high frequency of unforced errors in the defensive third, directly inflating the average goals per game metric during the autumn months.
The Spring Tightening and Relegation Low-Blocks
Conversely, as the relegation battle intensified in the final third of the season, bottom-half clubs shifted toward highly conservative, low-block defensive strategies. This late-season alteration meant that matches involving teams fighting survival saw a steep decline in open-play opportunities, making the Under 2.5 line highly profitable in April and May.
Evaluating the Predictive Power of Shot Volume Against Clean Sheet Rates
To build a reliable Over/Under model, an analyst must look past raw goal counts and prioritize advanced efficiency metrics like shot-to-goal conversion percentages and box entry volumes. A team might maintain a string of clean sheets due to exceptional goalkeeping or poor opposition finishing, but if their underlying data shows they are conceding twenty shots per game, their defensive structure is inherently unsustainable. Recognizing this statistical discrepancy allows a bettor to predict an impending defensive collapse weeks before it occurs, ensuring premium positioning on total goals lines.
Situational Factors That Neutralize High-Scoring Trends
Even within a historically high-scoring season like 2011/12, specific situational variables can completely neutralize aggressive offensive outputs. Adverse weather conditions, pitch degradation during the winter months, and acute squad fatigue caused by congested festive fixture periods all work to suppress overall match tempo. When these physical limitations are paired with high-stakes regional derbies where both managers prioritize risk mitigation, the theoretical probability of an explosive, high-scoring affair drops dramatically below the bookmaker’s baseline expectation.
Adapting Totals Strategies to Alternative Multi-Goal Environments
When the standard 2.5 goal line becomes hyper-efficiently priced by major international syndicates, analytical bettors must expand their focus toward niche, sub-market variations. Exploring alternative totals avenues, such as first-half goal lines, individual team totals, and targeted live in-play metrics, frequently reveals substantial pricing inefficiencies that go unnoticed by automated odds compilers. Under situational conditions where an elite team has a crucial continental fixture looming, looking into specialized alternative entertainment options on a casino online website can uncover unique mathematical trends that correlate with reduced second-half intensity. Transitioning across these alternative avenues ensures that a statistical model can still extract maximum value even when primary match totals offer thin profit margins.
Summary
The 2011/2012 Premier League season ufabet168 as a definitive blueprint for understanding the complexities of the Over/Under goals market. By analyzing how elite offensive efficiency, widespread defensive degradation, and stylistic tactical clashes combined to drive a historic 2.81 goals-per-match average, bettors can construct much more resilient predictive models. Success in the totals market requires a disciplined rejection of superficial media narratives, a constant monitoring of home and away performance splits, and the operational agility to pivot toward secondary wagering markets when primary lines lose their mathematical value.